Daily 4 - Jan 28
Class Performance
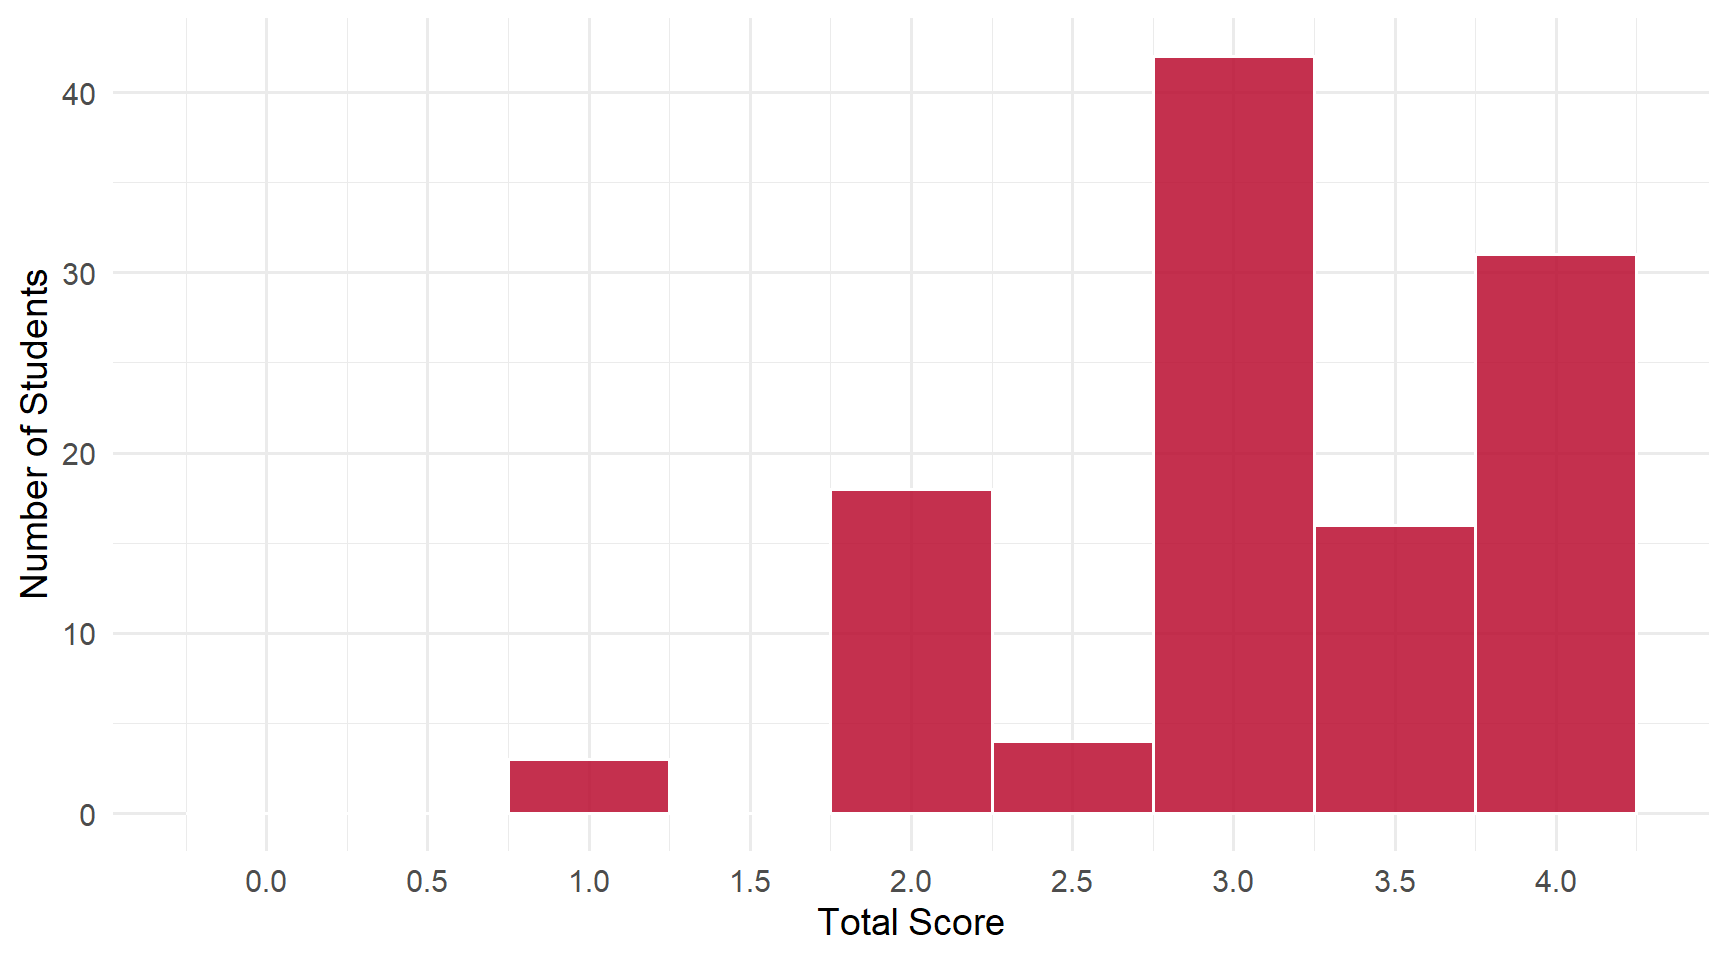
Students: 114 | Mean: 3.11 | Median: 3 | SD: 0.76
Scores ranged from 1 to 4 out of 4 points.
Score Distribution
Performance by Question
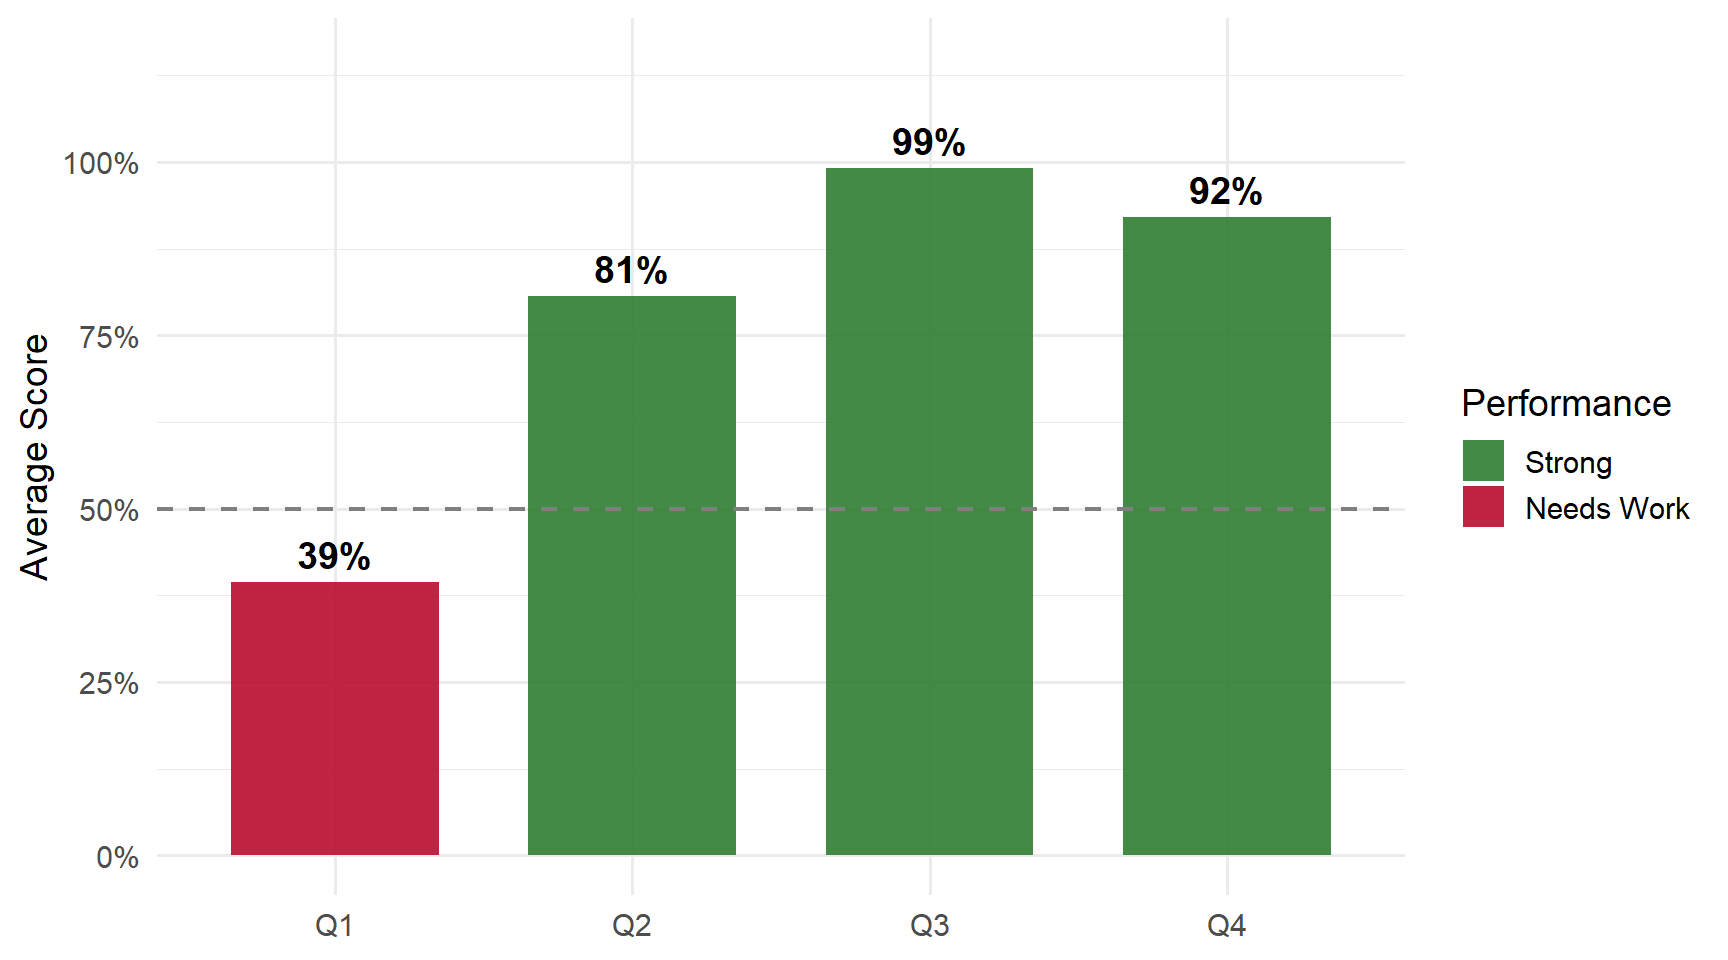
Questions
Q1: Write the formal definition of expected value
Correct Answer
E(Y) = Σ y_j f(y_j) — The expected value is the sum of each possible value multiplied by its probability.
Common Errors
- Writing “DK” or “Don’t Know” — Many students couldn’t recall the formula. This is a fundamental concept worth memorizing.
- Writing sample mean formula — Ȳ = (1/N)Σy_i is the sample mean, not expected value. Expected value weights by probability, not sample size.
- Verbal descriptions only — “Weighted average of outcomes” shows understanding but the mathematical formula was requested.
- Conditional expectation notation — E(Y|X) is conditional expectation, not the basic E(Y) formula.
Q2: How many observations will your project extract file have?
Correct Answer
50,388 observations
Common Errors
- Wrong numbers — Some wrote 144,265 or other values from different datasets
- Approximate answers — “About 50,000” or “50,000+” — Use exact counts from your data
- Digit transposition — 50,388 vs 50,288 vs 50,588 — Double-check your project file
Q3: The earnings distribution depicted in Figure 1 is _____ to the right.
Correct Answer
Skewed — The earnings distribution has a long tail extending to the right.
Common Errors
- Very few errors — This was the best-performing question
- Minor spelling variations — All accepted when intent was clear
- Wrong term — A few wrote unrelated terms like “earnings”
Q4: The right skew means that the sample _____ is larger than the sample _____.
Correct Answer
Mean, Median — In right-skewed distributions, extreme high values pull the mean above the median.
Common Errors
- Reversed order — Writing “median, mean” instead of “mean, median”
- Wrong terms — Using “mode” instead of “median” or unrelated terms like “breadth, width”
- Using synonyms — “Average” for mean is acceptable
Key Takeaways
Strengths: Skewness identification, effect of skew on mean vs median, project observation counts.
Review:
- Expected value formula E(Y) = Σ y_j p_j — This is essential for understanding random variables
- Know your project data — The extract file has exactly 50,388 observations
- Right skew pulls mean up — Mean > Median when there’s a long right tail