Daily 6 - Feb 4
Class Performance
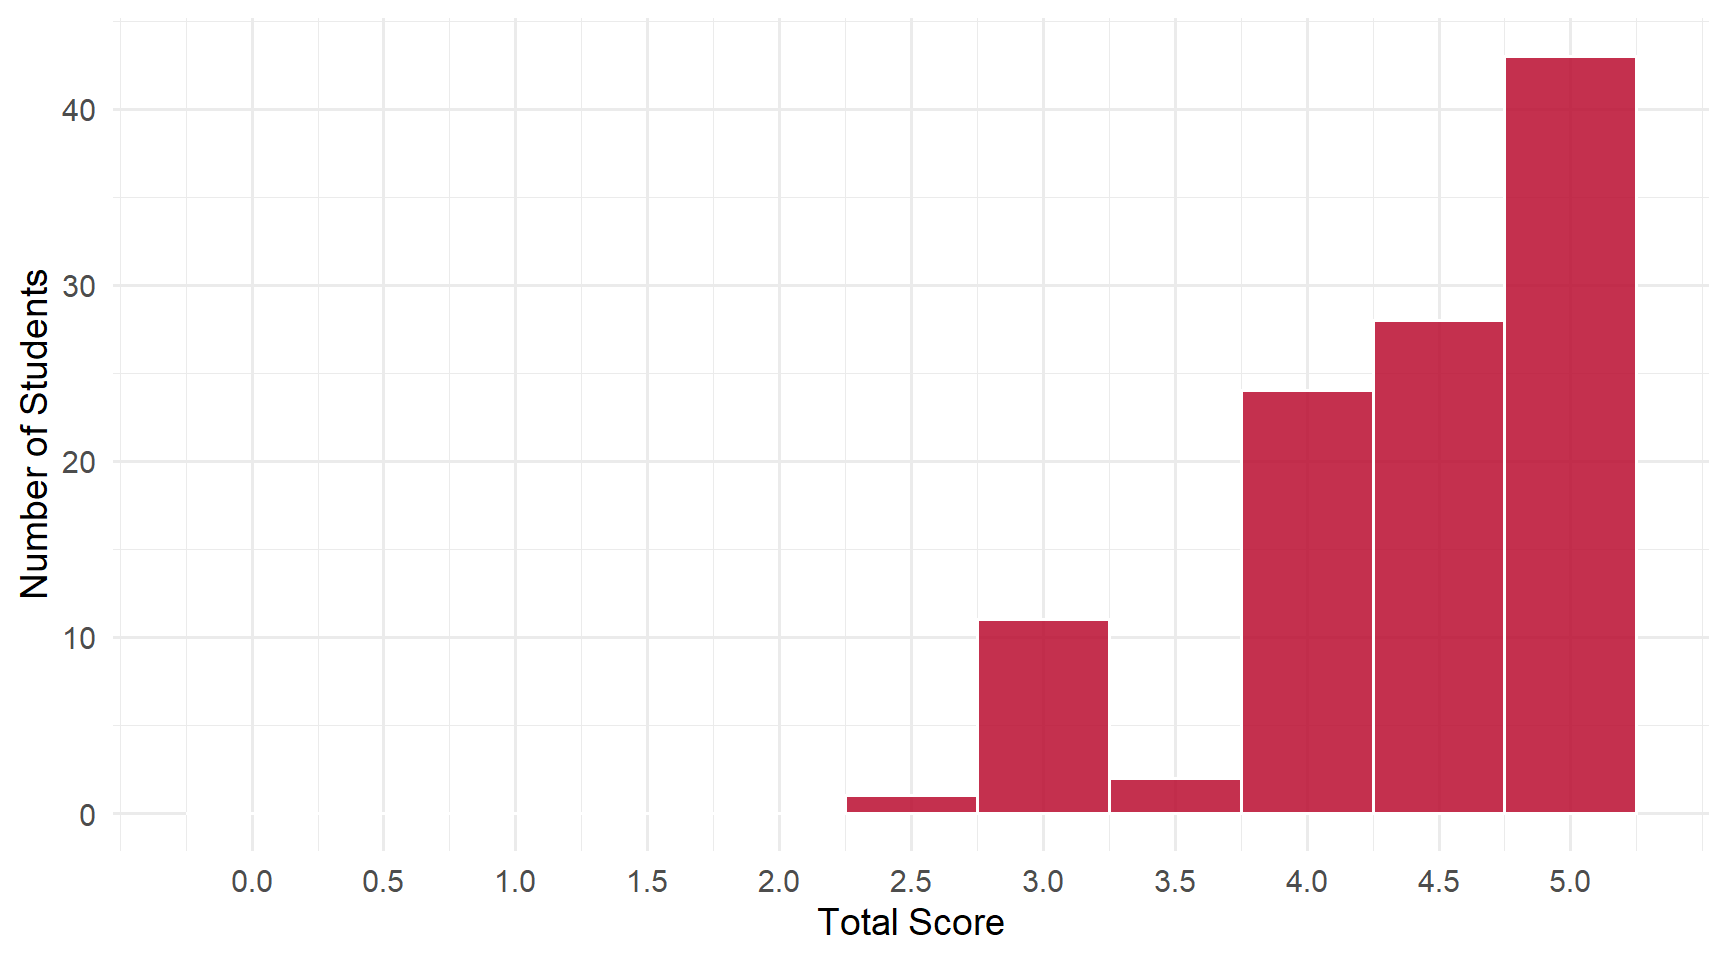
Students: 109 | Mean: 4.40 | Median: 4.5 | SD: 0.66
Scores ranged from 2.5 to 5 out of 5 points.
Score Distribution
Performance by Question
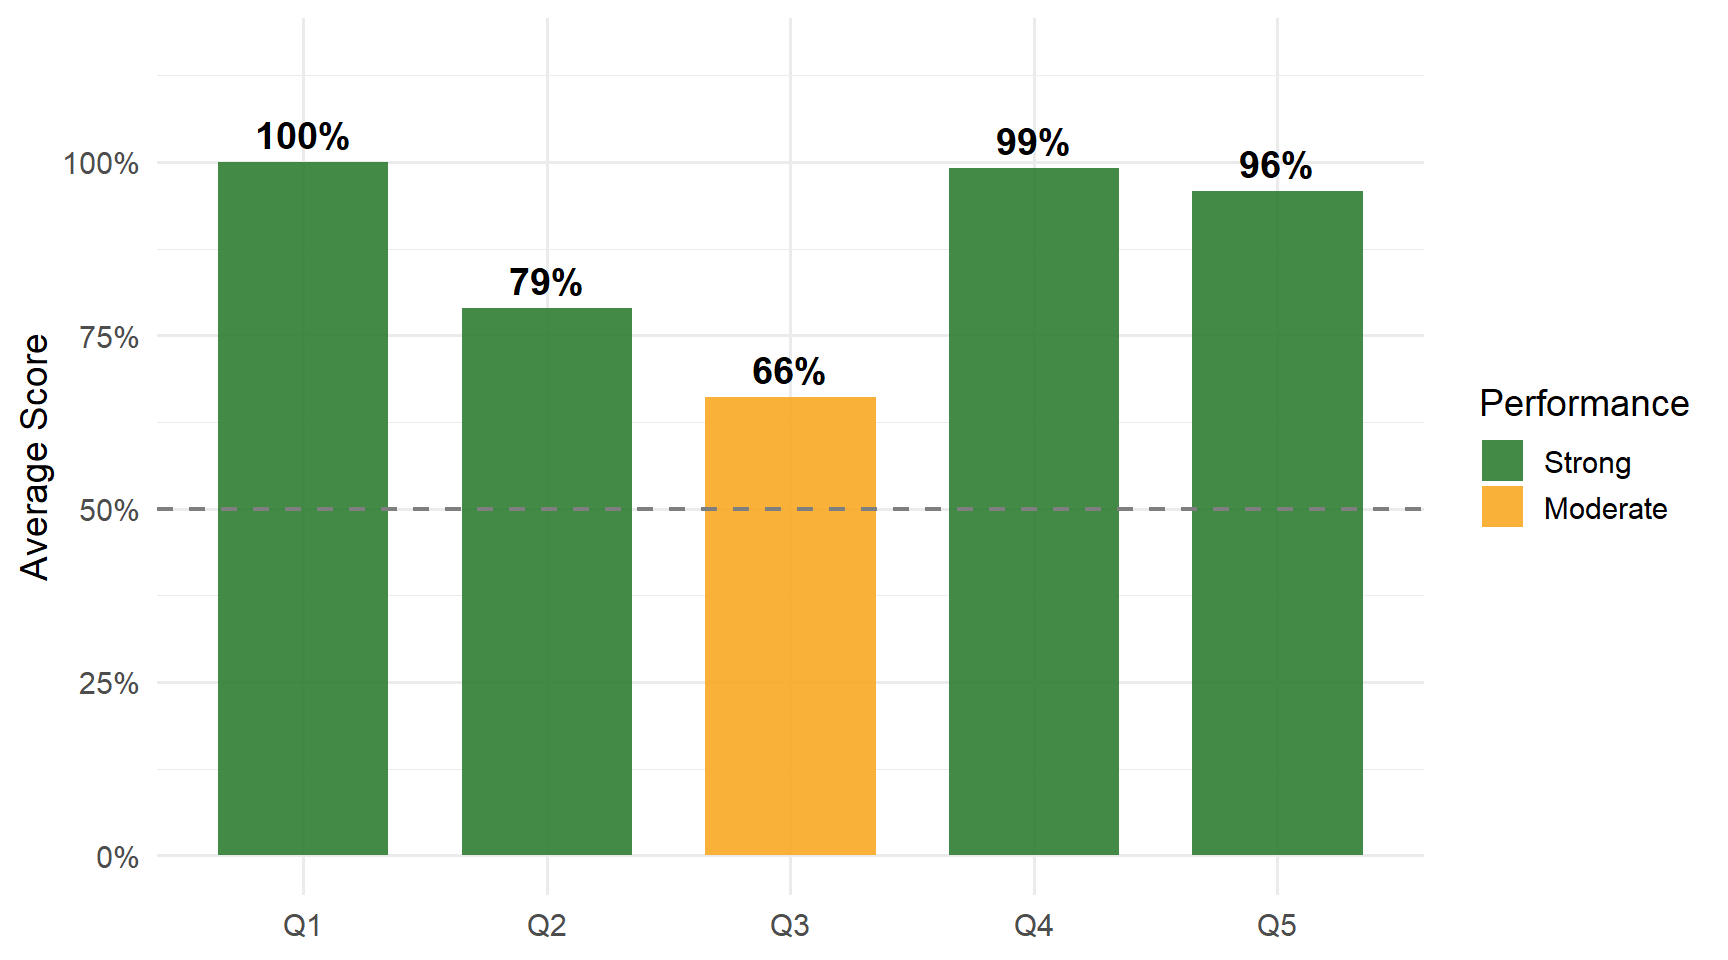
Questions
Q1: Estimating variance — plug in _____ for E(X) and replace outer expectation with sample _____
Correct Answer
\(\overline{X}\) (sample average); average — Plug in the sample mean for \(E(X)\) and replace the outer expectation with another sample average.
Common Errors
- Near-universal success — Almost every student correctly identified \(\overline{X}\) and “average.”
- Minor notation variants — Some wrote “x-bar” or “mean(x)” instead of \(\overline{X}\); all accepted as equivalent.
- No significant errors observed — This was the strongest question across the class.
Q2: True or false — if an estimator is unbiased, then it will equal the estimand
Correct Answer
False. An unbiased estimator equals the estimand on average across repeated samples, not necessarily for any single estimate.
Common Errors
- Answering “True” — The most common error. Students confused “unbiased on average” with “always equals the true value.”
- Crossed-out corrections — Several students initially wrote one answer then changed, suggesting uncertainty about this concept.
- Key distinction — Any single estimate can differ from the estimand due to sampling variability; unbiasedness is a property of the sampling distribution.
Q3: Explain what summarise does in the “Estimating the CEF” code chunk
Correct Answer
It computes the sample average of earnings for each age group — estimating the conditional expectation function (CEF).
Common Errors
- Missing “by age” — Many mentioned “mean earnings” or “average” but omitted that it groups by age. The grouping is central to estimating the CEF.
- Too vague — Answers like “simplifies the data,” “creates a table,” “displays data better,” or “compiles data” don’t capture the computational step.
- Describing the concept, not the computation — Some wrote about “conditional expectations” abstractly without stating the specific operation: computing mean earnings grouped by age.
Q4: The estimated CEF in Figure 6 has a _____ shape
Correct Answer
Concave — The estimated CEF shows a concave (inverted U) relationship between age and earnings.
Common Errors
- Near-universal success — Almost every student correctly identified the concave shape.
- Rare error: “variance” — One student wrote “variance” instead of describing the shape.
- No other significant errors — This was one of the strongest questions alongside Q1.
Q5: That shape is well-fit by a _____ in age
Correct Answer
Quadratic — The concave shape is well-fit by a quadratic (second-degree polynomial) in age.
Common Errors
- Answering “polynomial” — While quadratic is a polynomial, the specific answer is quadratic. “Polynomial” is too broad.
- Answering “increase” or “condition” — These don’t describe a functional form.
- Overall strong performance — The vast majority correctly identified “quadratic.”
Key Takeaways
Strengths: Variance estimation plug-ins (Q1), concave CEF shape (Q4), quadratic fit (Q5).
Review:
- Unbiased ≠ always correct — unbiased means correct on average across samples, not for every single estimate
summarisecomputes average earnings by age — not just “displays” or “organizes” data; it calculates the mean within each group- Be specific about functional forms — “quadratic” is more precise than “polynomial”