Daily 9 - Feb 16
Class Performance
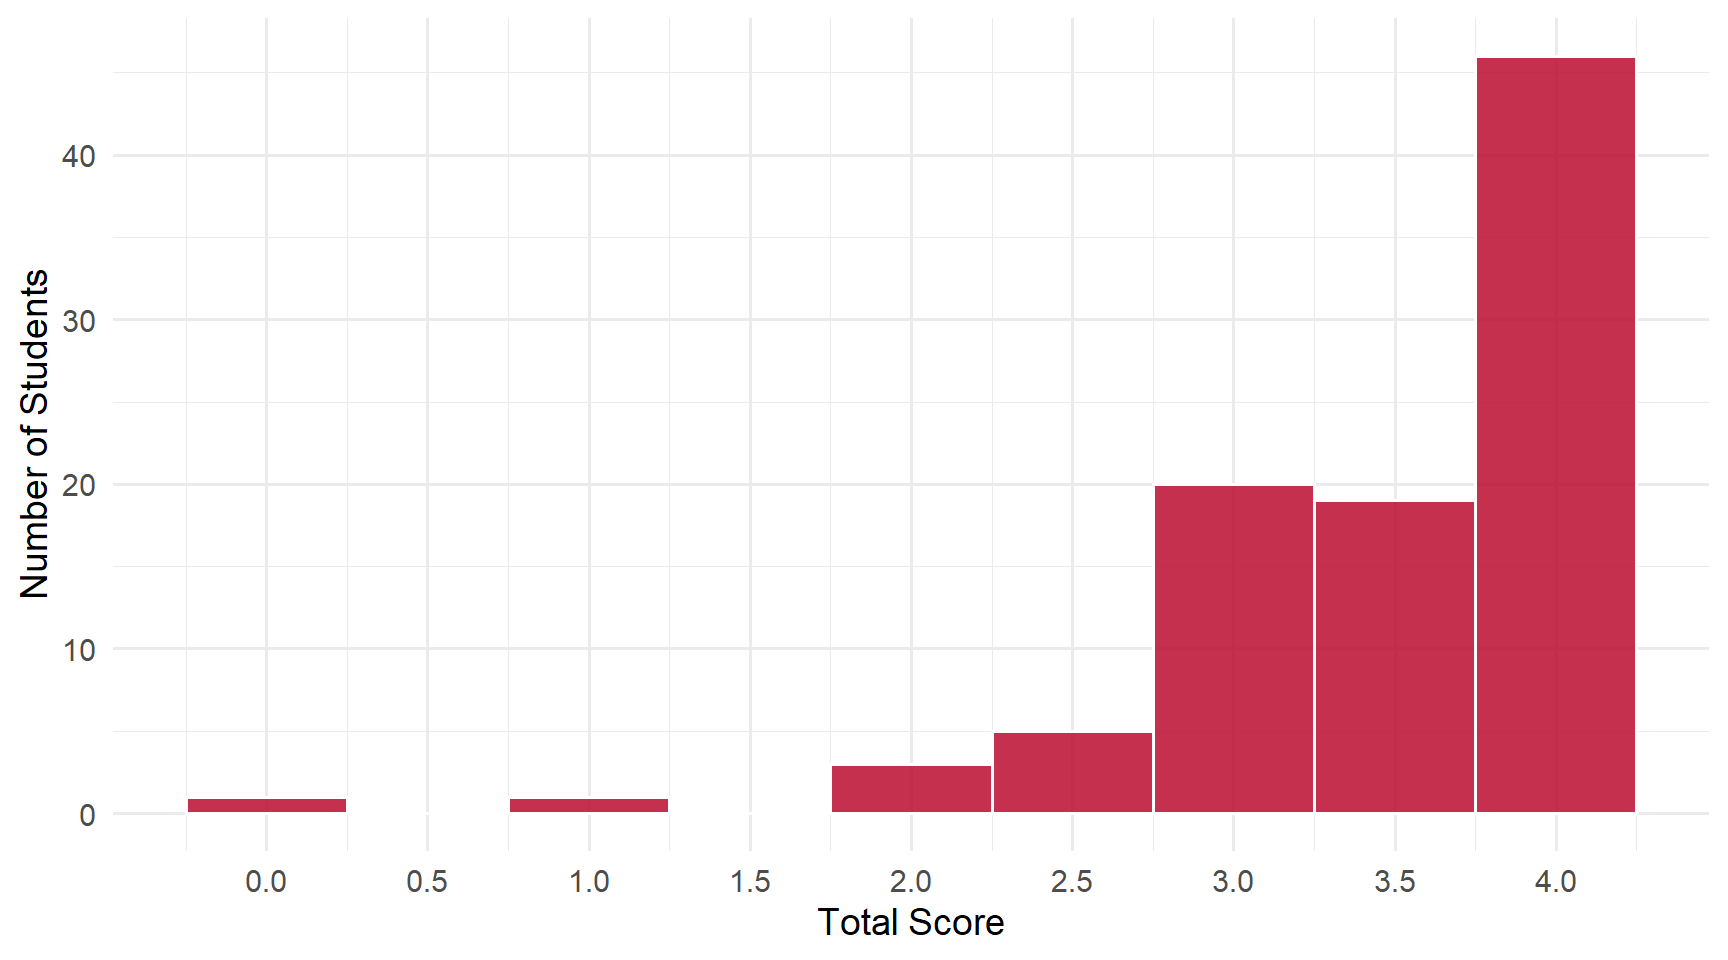
Students: 95 | Mean: 3.47 | Median: 3.5 | SD: 0.70
Scores ranged from 0 to 4 out of 4 points.
Score Distribution
Performance by Question
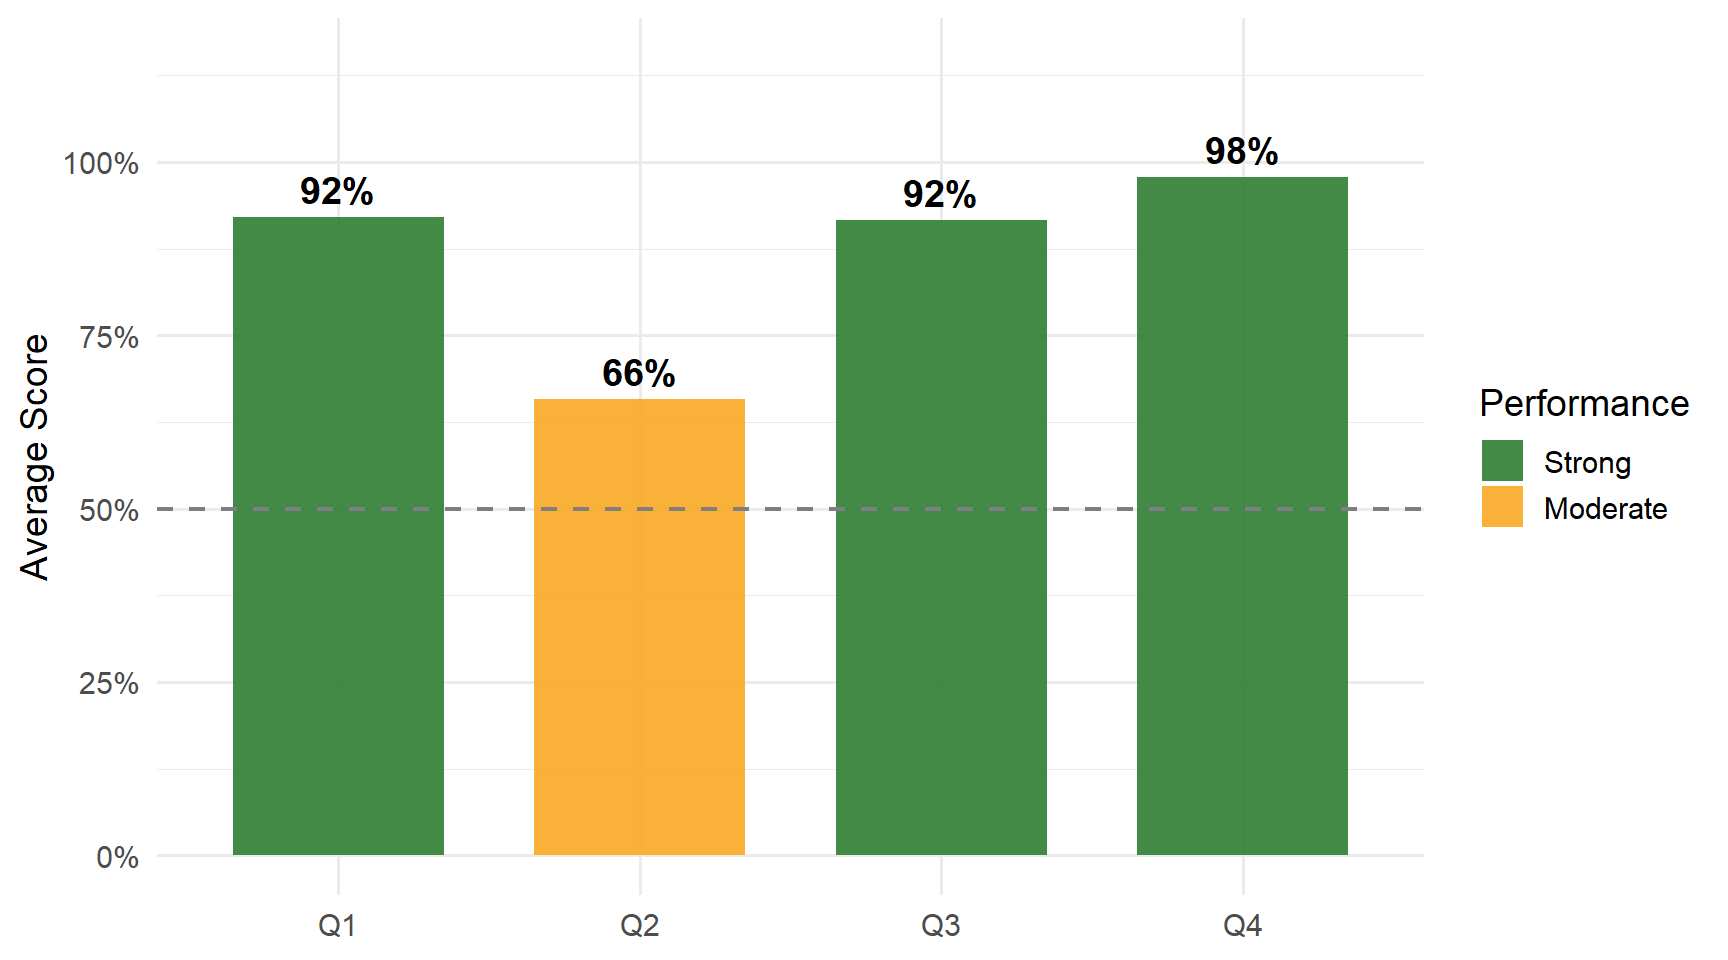
Questions
Q1: One-sample t-statistic formula
Correct Answer
\(t = \frac{\overline{Y} - 0}{\text{se}(\overline{Y})}\) — the sample mean minus the null value (0), divided by the standard error of the sample mean.
Common Errors
- Generic formula without specifics — Writing “estimate / se(estimator)” without showing the sample mean or null value of 0.
- Wrong numerator — Using 0 instead of the sample mean in the numerator (e.g., (0 - \(\mu_0\)) instead of (\(\overline{Y}\) - 0)).
- Two-sample formula instead — Writing the difference in two group means for what should be a one-sample test.
Q2: Two-sample t-statistic formula (small vs regular class)
Correct Answer
\(t = \frac{\hat\mu_{small} - \hat\mu_{regular} - 0}{\text{se}(\hat\mu_{small} - \hat\mu_{regular})}\) — the difference in sample means divided by the standard error of that difference.
Common Errors
- Repeating Q1’s one-sample formula — Many students wrote the same one-sample t-statistic from Q1 instead of adapting to a two-sample comparison.
- Generic or vague formula — Writing “estimate - null / se(estimator)” without specifying the small vs regular class means, or using wordy descriptions instead of a formula.
- Wrong denominator — Subtracting the two standard errors (se(small) - se(regular)) instead of using the standard error of the difference in means, se(\(\hat\mu_{small} - \hat\mu_{regular}\)).
Q3: Difference in average test scores (STAR experiment)
Correct Answer
14 points — the difference in average kindergarten test scores between small and regular class types is about 14 points.
Common Errors
- Writing 18 points — Likely confusing with a different comparison or misremembering the STAR experiment results.
- Writing 5 or 13 points — Misremembering the magnitude of the small vs regular class difference.
- Left blank — Some students did not provide an answer. Review the STAR experiment results for this key finding.
Q4: Classical measurement error bias direction
Correct Answer
Downward (toward zero) — classical measurement error in X biases the correlation between X and Y toward zero (attenuation bias).
Common Errors
- Writing “independently” — Measurement error doesn’t make variables independent; it attenuates the observed relationship toward zero.
- Wrong direction — Saying the bias is “upward” or “away from zero.” Classical measurement error always attenuates toward zero.
- Confusing with omitted variable bias — Omitted variable bias can go either direction; classical measurement error specifically biases downward.
Key Takeaways
Strengths: One-sample t-statistic well understood | STAR experiment difference of ~14 points widely known | Measurement error attenuation bias correctly identified.
Review:
- Two-sample t-statistic — the numerator shows the difference in group means, and the denominator is the se of that difference
- Don’t repeat Q1 for Q2 — the two-sample test has a fundamentally different structure from the one-sample test
- se of the difference \(\neq\) difference of the se values — these are distinct quantities