Daily 12 - Mar 02
Class Performance
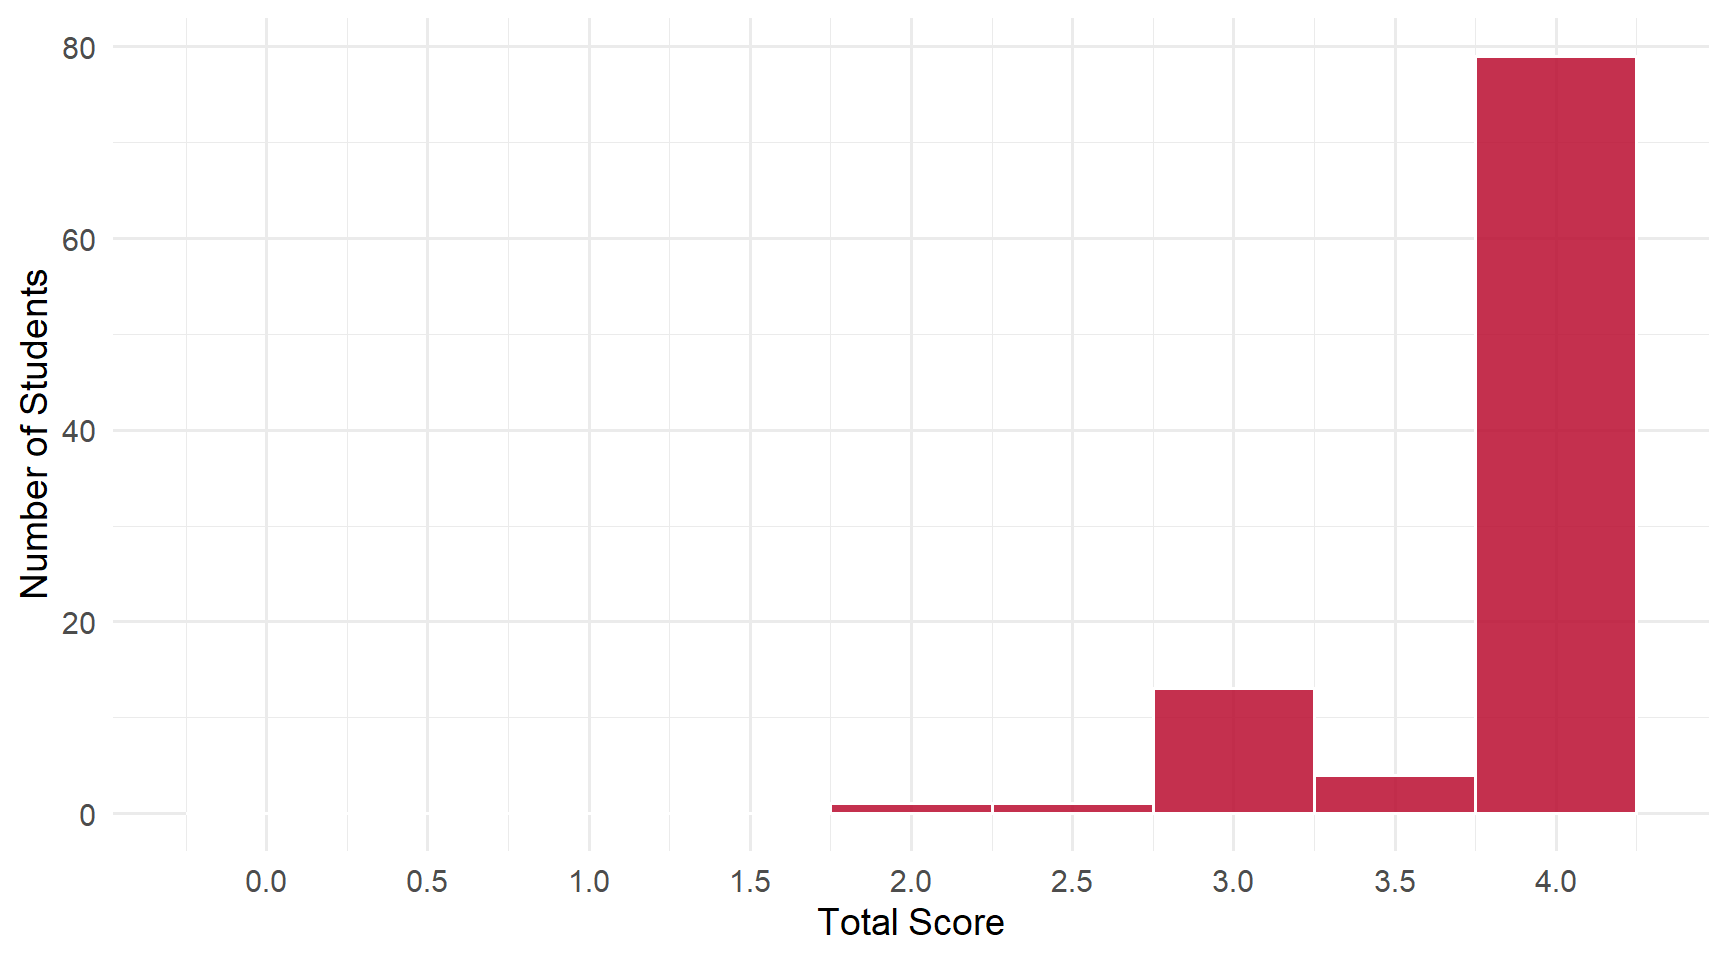
Students: 98 | Mean: 3.81 | Median: 4 | SD: 0.42
Scores ranged from 2 to 4 out of 4 points.
Score Distribution
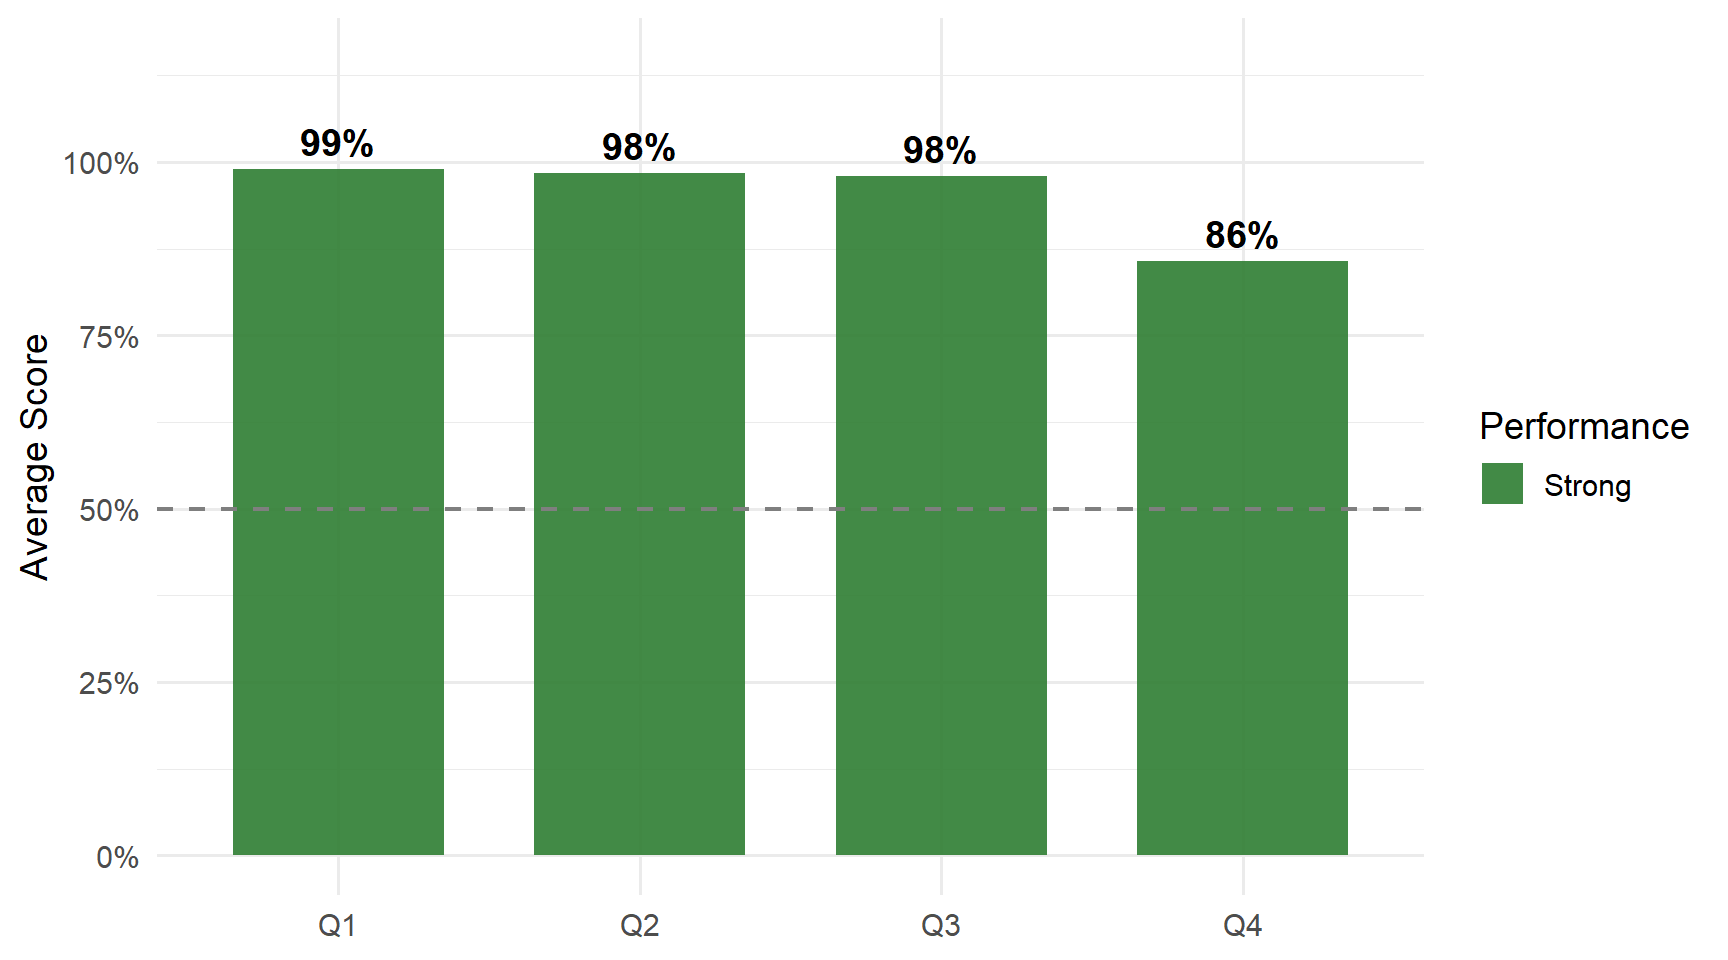
Performance by Question
Questions
Q1: CLT Explorer — Distribution, Mean, SD
Correct Answer
The CLT explorer assumes a population distribution that is exponential with a mean of 30.3 and a SD of 30.3.
Common Errors
- Incorrect mean value — Some students wrote 3.8 or 3.4 instead of 30.3, likely misreading the CLT explorer display.
- Wrong distribution type — A few students wrote “normal” instead of “exponential.” The CLT explorer specifically uses an exponential distribution.
- Mixing up mean and SD — For the exponential distribution, the mean and SD are both 30.3. Some students provided different values for each.
Q2: True SE vs. Estimated SE
Correct Answer
The true standard error is 5.533 (or 5.53). The estimated standard error is sample dependent — any specific numeric estimate (e.g., 3.462, 5.61) is acceptable.
Common Errors
- Only providing one SE value — Some students gave only the true SE without a separate estimated SE value. Both are required.
- Providing formulas without numbers — Writing the SE formulas (σ/√n, s/√n) without computing the actual numeric values.
- Incorrect true SE — Some wrote 6.53 instead of 5.533. The true SE = σ/√n = 30.3/√30 ≈ 5.533.
Q3: Interval Prediction Challenge Bounds
Correct Answer
The lower bound is 22 (or ~21.6) and the upper bound is 38 (or ~38.4) for the interval capturing 95% of all sample means.
Common Errors
- Incorrect lower bound — One student wrote 30 as the lower bound. The interval is centered at 30.3 and extends roughly ±1.96 SE in each direction.
- Incorrect upper bound — One student wrote 68 as the upper bound, far too wide. The 95% interval is approximately [22, 38].
- Reversed or mismatched bounds — Some students provided bounds that didn’t form a symmetric interval around the mean of 30.3.
Q4: Best Regression Approximation Type
Correct Answer
Regression provides the best linear approximation to the conditional expectation function (CEF).
Common Errors
- Writing “causal” — Several students wrote “causal.” Regression estimates associations; it does not inherently provide causal estimates without additional assumptions.
- Other incorrect terms — Students wrote “descriptive,” “metric,” “residualized,” “predictive,” or “direct.” The key term is specifically linear.
- Confusing with variable types — Some wrote “dependent variable” or “independent variable.” The question asks about the type of approximation, not the variables involved.
Key Takeaways
Strengths: Exponential distribution identified correctly | SE values computed accurately | Interval bounds well understood.
Review:
- Regression provides a linear approximation to the CEF — not causal, descriptive, or predictive
- True SE = σ/√n — make sure to compute the numeric value, not just write the formula
- Read CLT explorer values carefully — the mean is 30.3, not 3.03 or 3.8