Daily 20 - Apr 06
Class Performance
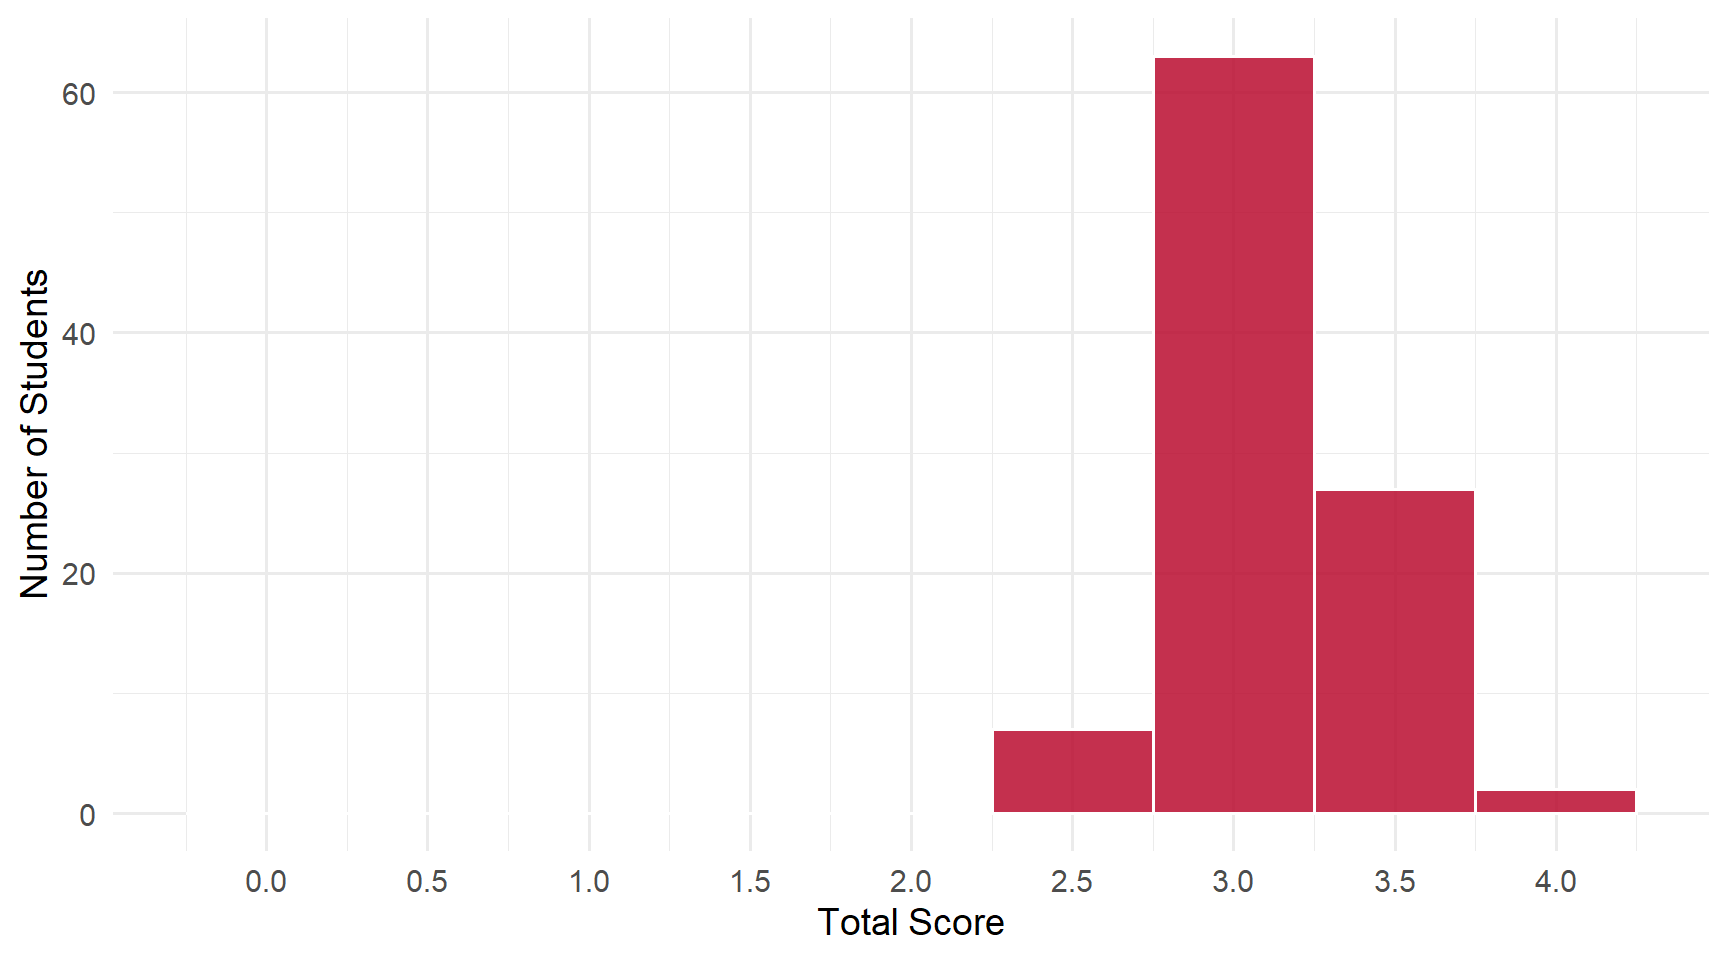
Students: 99 | Mean: 3.12 | Median: 3 | SD: 0.30
Scores ranged from 2.5 to 4 out of 4 points.
Score Distribution
Performance by Question
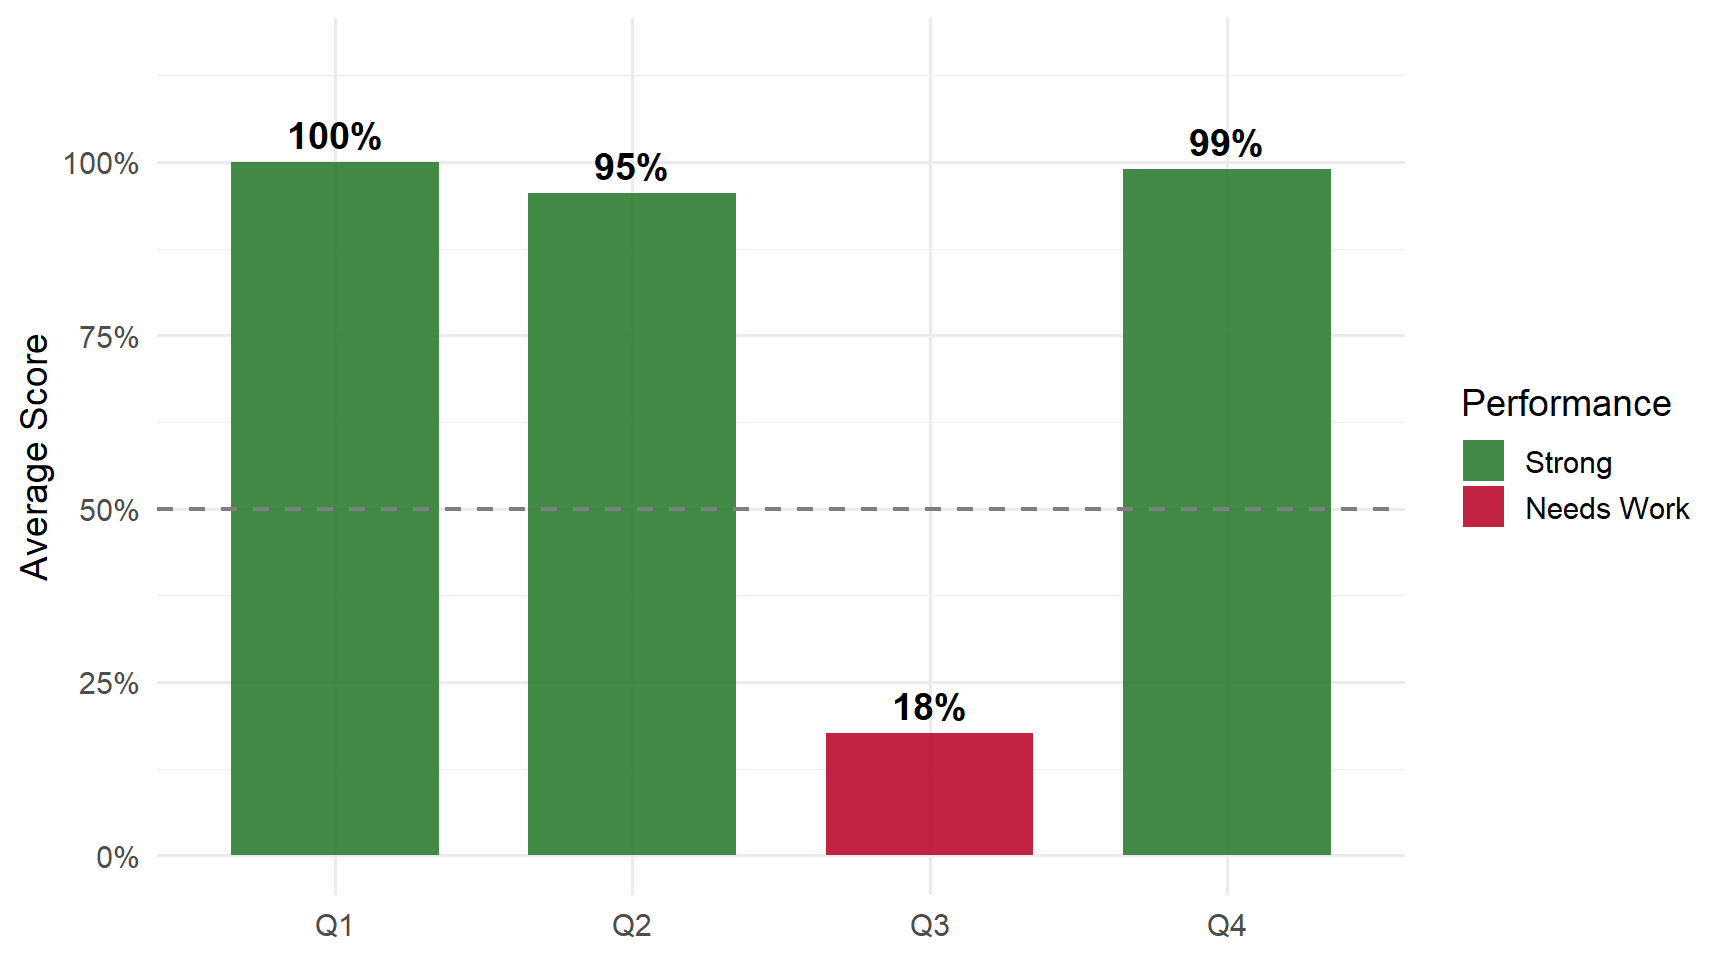
Questions
Q1: AI Team Proposal Quality Effect
Correct Answer
AI improves team proposal quality by roughly 0.15 standard deviations but the result is not statistically significant at the 10% level.
Common Errors
- Close values (0.147, 0.16) — Accepted as approximately correct.
- “Is” instead of “is not” — A few students misread the significance stars.
Q2: Gender Wage Gap Among Singles
Correct Answer
The gender wage gap among singles is 13–14% or roughly 8 points lower than the full-sample gap.
Common Errors
- Writing “9” or “7” for the second blank — close but not 8.
- Writing “3” or “4” — from misreading the table; subtract singles from full-sample gap.
Q3: MVA Percent Increase and CD Consistency
Correct Answer
MVA deaths increase by 14.3 percent (coefficient divided by baseline 32.5), which is consistent with Carpenter–Dobkin’s findings.
Common Errors
- Writing “15” with “is” — Half credit: magnitude close to 14.3 and correct conclusion, but missed the 1-decimal-place requirement.
- Writing “4.6” or “2.7” — Zero credit: calculation setup wrong. Use coefficient / 32.5 × 100.
- Any value with “is not” — Zero credit when the conclusion is wrong.
Q4: Kentucky WBA Cap Effect
Correct Answer
The increase in Kentucky’s WBA cap caused time out of work to rise by 20%.
Common Errors
- Wrong percentage (10%, 25%, 70%) — Partial credit for correct direction.
- Writing “fall” — Incorrect direction; higher WBA caps increase time out of work.
Key Takeaways
Strengths: AI team effect understood | Wage gap computation strong | WBA direction and magnitude correct.
Review:
- Q3 precision — Always report percentages to the requested decimal (1 decimal place means 14.3, not 15)
- Q3 setup — Percent increase = coefficient / baseline rate × 100; use the 32.5 MVA baseline
- CD consistency — The MVA findings align with Carpenter–Dobkin’s earlier age-21 mortality work