Daily 19 - Apr 01
Class Performance
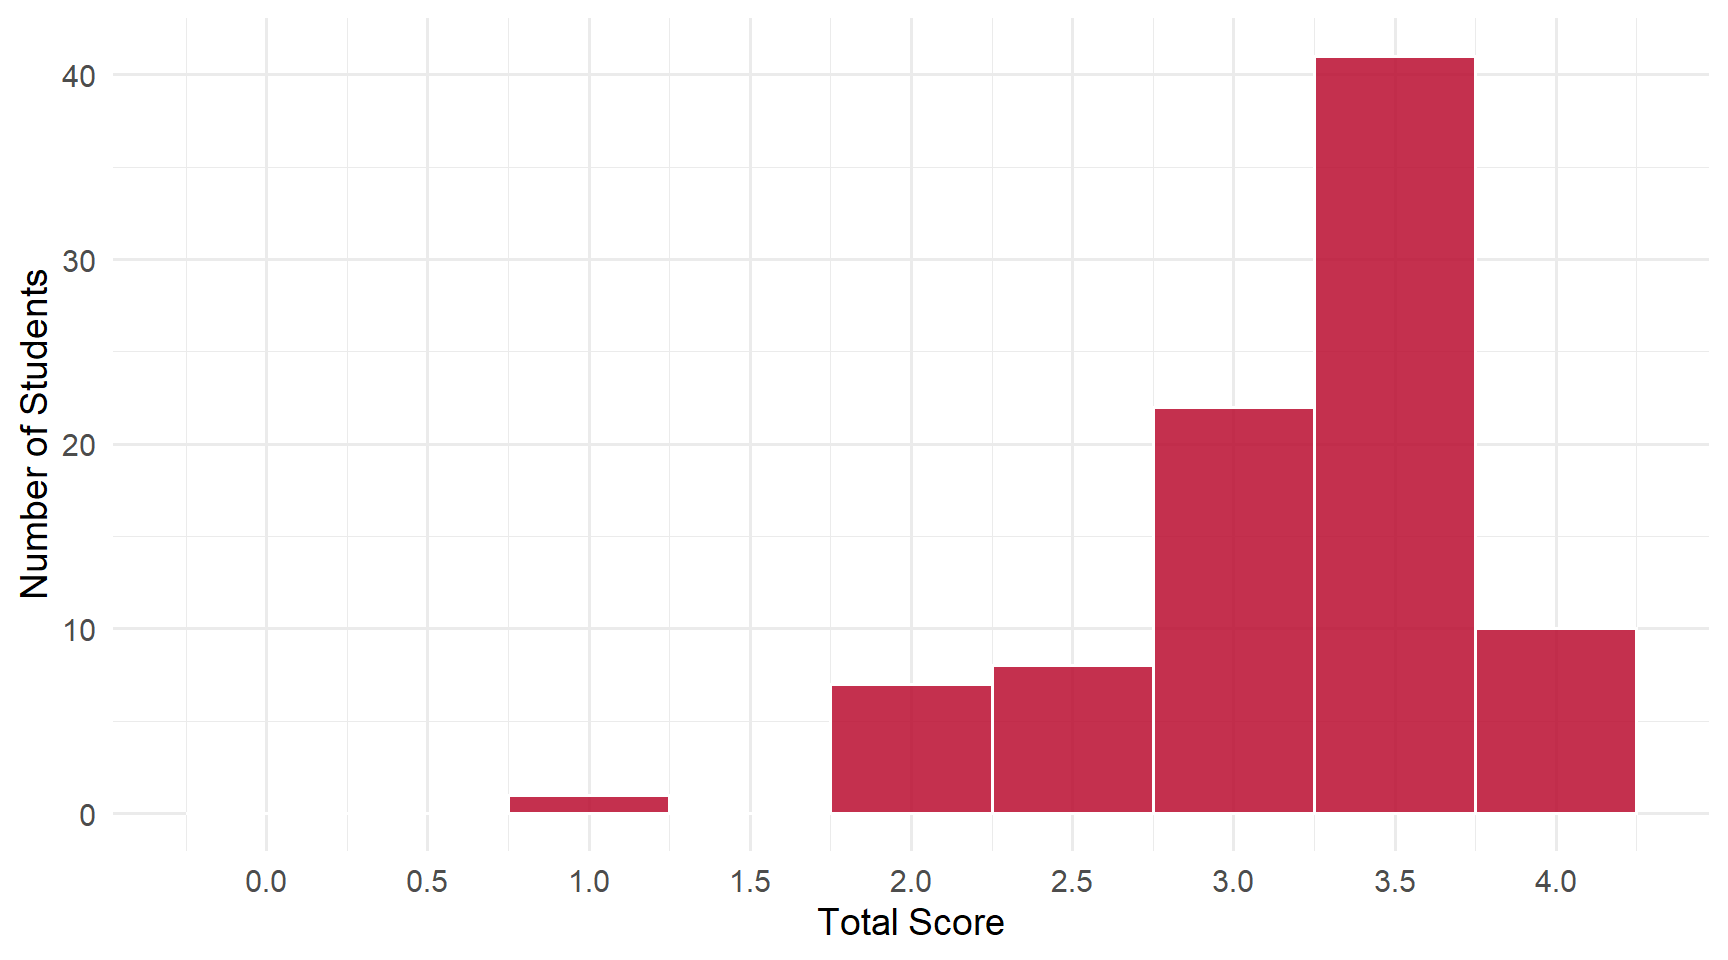
Students: 89 | Mean: 3.20 | Median: 3.5 | SD: 0.58
Scores ranged from 1 to 4 out of 4 points.
Score Distribution
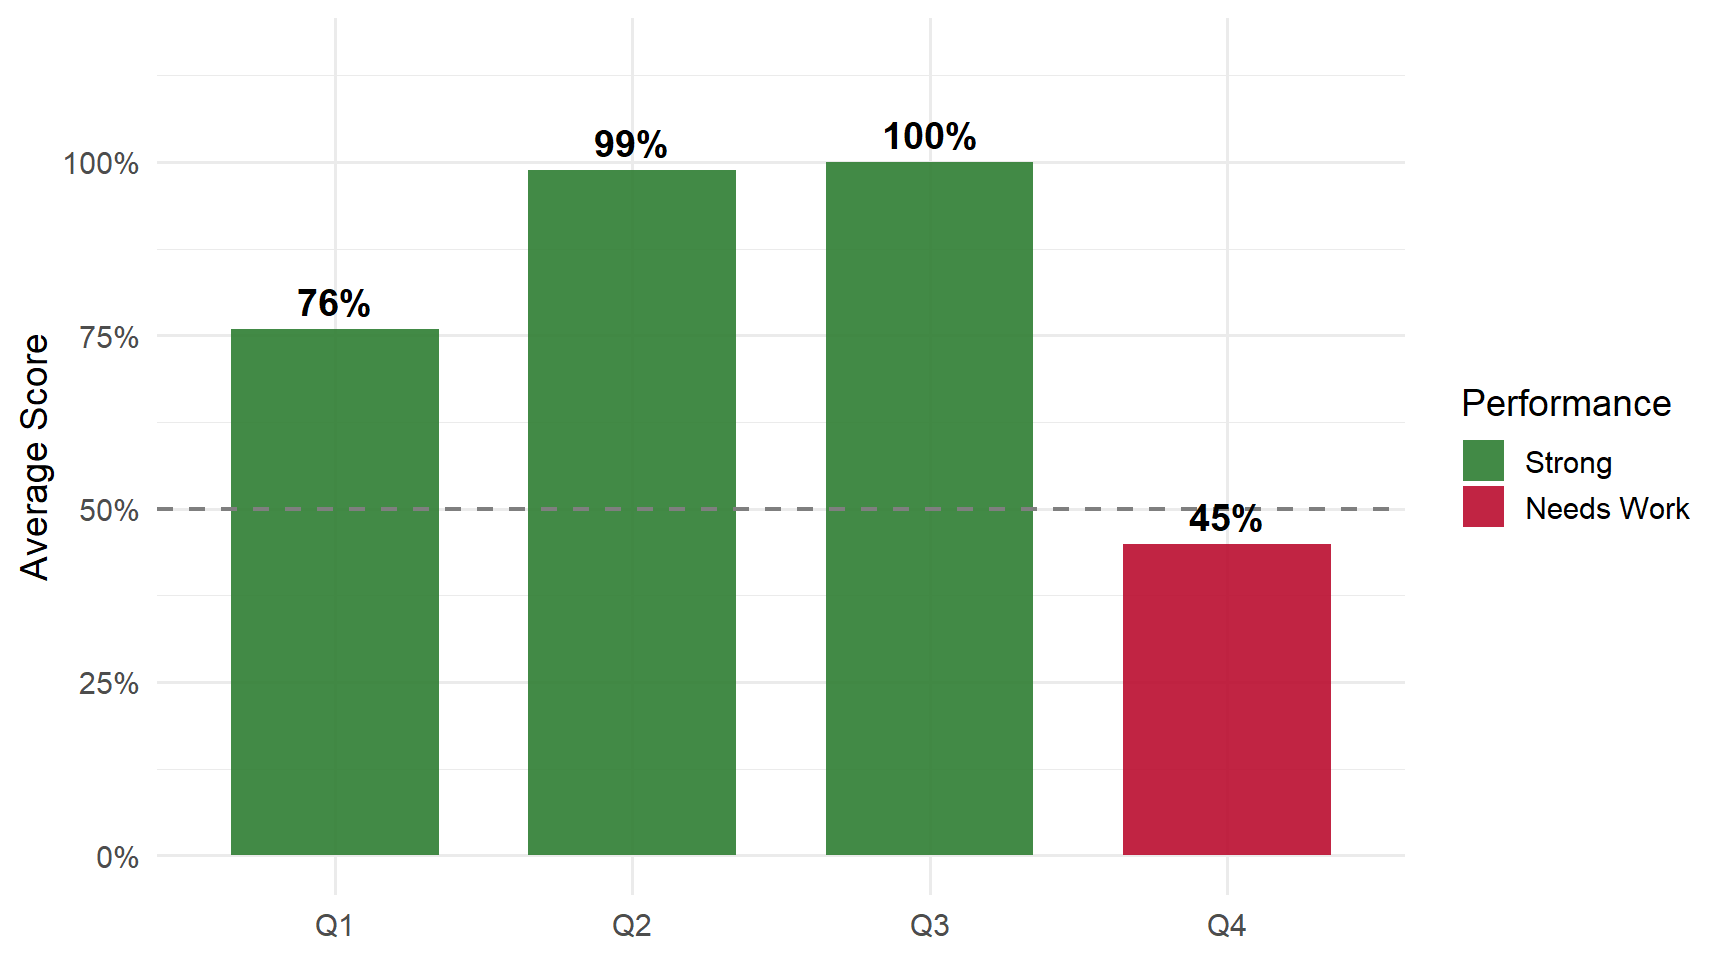
Performance by Question
Questions
Q1: Deaths Rise at Age 21 (Figure 1)
Correct Answer
Deaths from all causes rise by roughly 10 per 100,000 between the month before and after age 21.
Common Errors
- Writing “12” or “13” — Too high. The figure shows approximately 10.
- Writing “8” — Too low. Read the y-axis discontinuity carefully.
- Close values (11) — Received partial credit.
Q2: Key RD Assumption
Correct Answer
Average potential outcomes are continuous at the cutoff value of the running variable.
Common Errors
- Excellent performance — Nearly all students correctly identified “continuous.”
- “Continuity” accepted — Acceptable synonym for the same concept.
Q3: NHIS Characteristics and Age 21
Correct Answer
Observed characteristics are unrelated to whether the individual turned 21 in the month of their interview.
Common Errors
- Very few errors — Nearly all students correctly wrote “unrelated.”
- Why it matters — If characteristics were related to the cutoff, it would suggest manipulation of the running variable.
Q4: Quadratic Specification Results (Table 3)
Correct Answer
Turning 21 increased deaths by roughly 9.5 per 100,000, with 8.5 (or ~90%/almost all) attributed to external causes.
Common Errors
- Writing “10, 8” or “10, 9” — Close but imprecise. The quadratic estimates are approximately 9.5 and 8.5.
- Wrong values (2, 3, 4) — From different rows or specifications.
- Missing “external” — Must identify external causes (accidents, injuries).
Key Takeaways
Strengths: RD continuity assumption mastered | NHIS balance check understood | Figure reading mostly accurate.
Review:
- Figure 1 — Deaths rise by about 10 per 100,000 at the age-21 cutoff
- Quadratic specification — 9.5 total deaths, 8.5 from external causes
- RD validity — Continuity of potential outcomes + balance of characteristics support the design