Daily 14 - Mar 16
Class Performance
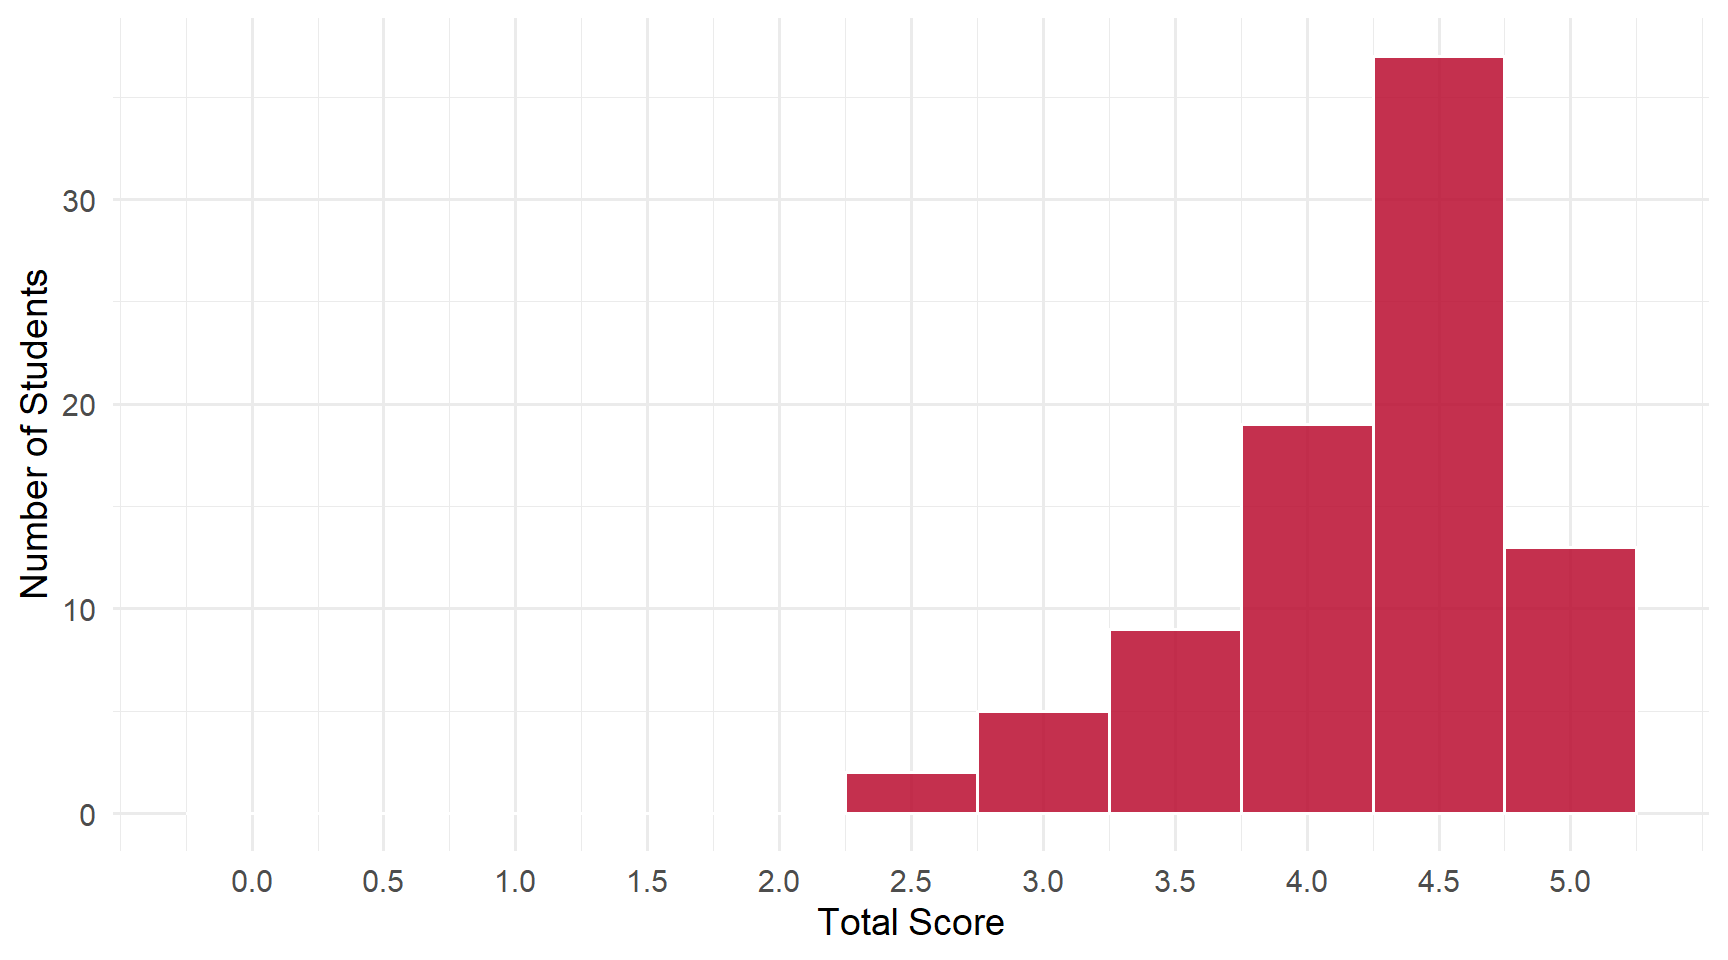
Students: 85 | Mean: 4.22 | Median: 4.5 | SD: 0.60
Scores ranged from 2.5 to 5 out of 5 points.
Score Distribution
Performance by Question
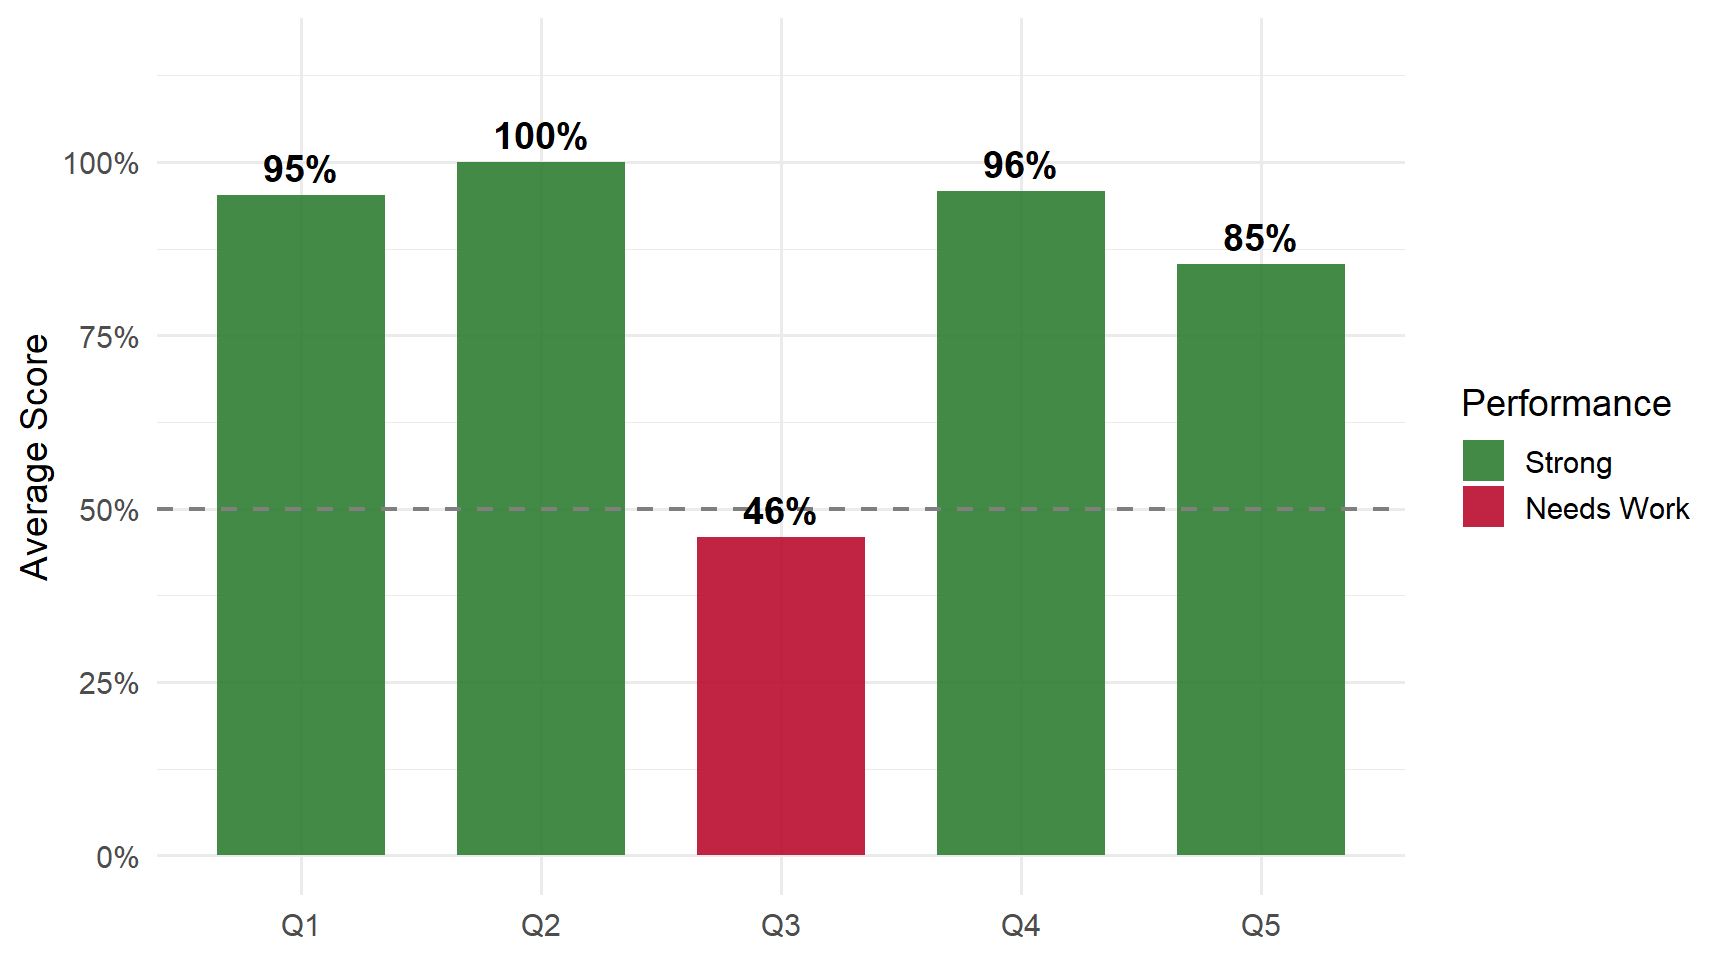
Questions
Q1: Population Regression Coefficients Minimize _____
Correct Answer
The population regression coefficients minimize the MSE (mean squared error) between the outcome and the regression approximation.
Common Errors
- Writing “linear” or “error” — Related concepts but the specific answer is MSE.
- Writing “squared error” without “mean” — Must include “mean” for the full concept.
- Writing “dispersion” — Dispersion describes variability in general, not the regression objective function.
Q2: OLS Estimator of Beta_1
Correct Answer
cov(x,y) / var(x) — the sample covariance of x and y divided by the sample variance of x.
Common Errors
- Very few errors — Most students correctly wrote the formula. Well done!
- Minor notation differences — Some used summation form; both are acceptable as long as the structure is correct.
Q3: Return to Schooling from “Level” Regression (Table 3)
Correct Answer
The average return to another year of schooling is 29.6 cents (or 29.455/29.655).
Common Errors
- Writing “30 cents” — Close but not precise enough for full credit; the table shows approximately 29.6.
- Writing “5.2%” — This is from the log regression, not the level regression. Read column headers carefully.
- Writing “50 cents” or other wrong values — Misreading the table.
Q4: Frisch-Waugh Residual Interpretation
Correct Answer
The residual from a regression of x₁ on x₂. This is the Frisch-Waugh theorem.
Common Errors
- Swapping x₁ and x₂ — We regress x₁ on x₂, not x₂ on x₁.
- Listing x₂ twice — Writing “residual, x₂, x₂” is a copying error.
- Incomplete answers — Must clearly state all three parts.
Q5: Return to Schooling from Table 4
Correct Answer
The average return is 7.5 (percent) and the coefficient is statistically significant.
Common Errors
- Writing “is not” significant — The coefficient is statistically significant.
- Wrong values (1.5, 15, 75%) — Misreadings of the table.
- Writing “7.3” or “7.6” — Close but imprecise.
Key Takeaways
Strengths: MSE concept well understood | OLS formula mastered | Residual interpretation mostly correct.
Review:
- Level vs. log regressions — 29.6 cents from level, 5.2% from log
- Frisch-Waugh — Regress x₁ on x₂ (not the reverse) to get the residual
- Read tables carefully — Match values to the correct column and specification